This blog series is sponsored by Secure Systems Innovation Corporation (SSIC), a cyber risk advisory services firm that empowers business decision making. To learn more about SSIC and its support for this research, please visit their website and/or related blog post on this topic. Posts in this series: Part 1: Ransomware payment Rate; Part 2: Ransom Demands; Part 3: Ransomware Prevalence
In this third installment of our “Measuring Ransomware” series, we jump over to the left side of the risk equation to study ransomware prevalence. We’ve dealt with things that occur after a ransomware infection (e.g., pay a ransom) but we haven’t talked about how likely it is for an organization to become infected in the first place. That’s our task for today and it’s not an easy one.
“Why’s that?” you ask, “I’ve seen tons of stats about the rise of ransomware.” And that’s true enough — there are certainly a lot of data points on the topic. Our absurdly long scratchpad of notes undergirding this blog post is all the evidence I need of that. But as we began to organize those notes, it became apparent that the many different sources charting the “rise of ransomware” all have different notions of what that rise entails. Let’s walk through some examples.
Stats on ransomware families or variants in the wild
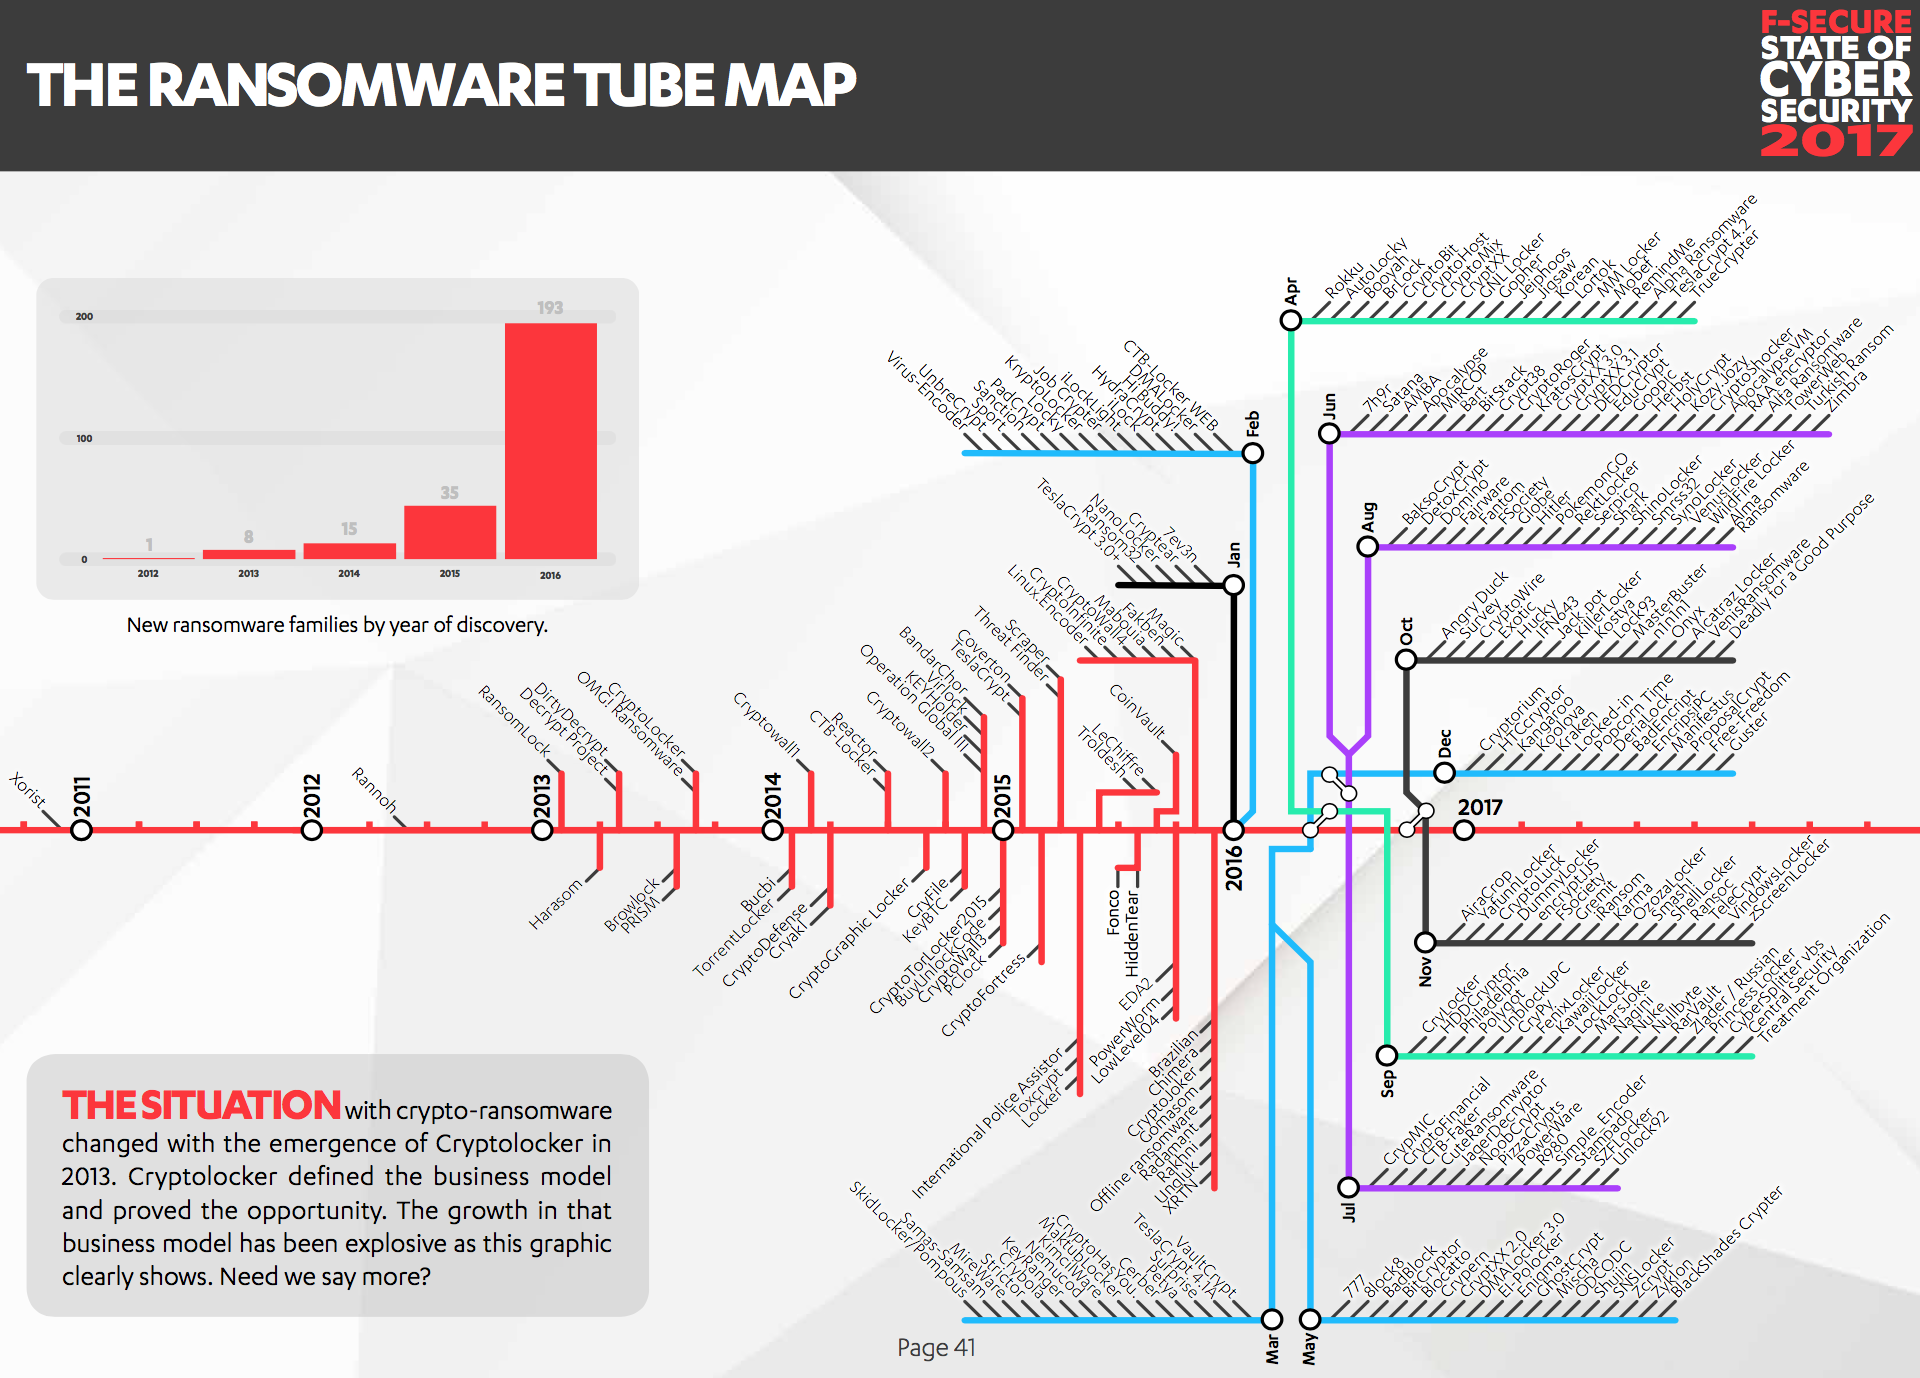
New ransomware families. Source: F-Secure, State of Cyber Security 2017.
Quite a few anti-malware vendors maintain running tallies of new ransomware families and variants in the wild. F-Secure’s “Ransomware Tube Map” is an excellent example of this. It’s clear from the chart that the number of families is rising and diversifying sharply…but what that tells us about the probability of any given organization being infected with ransomware is less clear. One might speculate more variants would lower detection capability and thus increase infections, but the shape, slope, and fit of that regression line is anyone’s guess. Please don’t misinterpret — I think this is helpful information. But it’s important to understand how such data points inform our assessment of ransomware risk.
In such matters, the FAIR framework is an invaluable tool. What we’d like to ultimately get to is something like what FAIR terms Loss Event Frequency (LEF) — the frequency, within a given timeframe, that loss is expected to occur. If you’re familiar with the FAIR ontology (or want to grab a copy here), you’ll know that LEF is comprised of several subcomponents like Probability of Action, Threat Capability, and Resistance Strength. Statistics like the number of ransomware families/variants/samples tell us mostly about Threat Capability — the skills, resources, and overall level of force a threat actor is able to exert. If we see cyber criminals cranking out new ransomware at high volume, it suggests business is good, demand is high, and their supplies and skills are sufficient to meet that demand. These data points may inform us about Probability of Action too; by creating ransomware, criminals are exhibiting intent to do harm and acting on it.
Stats on ransomware detections and attacks
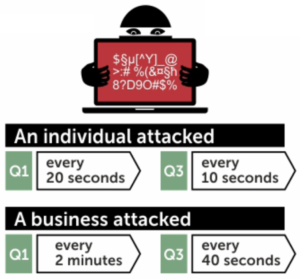
Ransomware attack rate. Source: Kaspersky, The Ransomware Revolution.
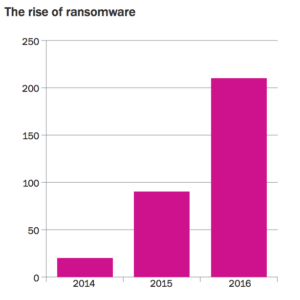
Another genre of statistics commonly referenced about the growth of ransomware is the number of attacks or detections. Terminology can be a bit tricky here because it’s not always consistent among sources. But they generally agree that these events are not actual incidents. For instance, SonicWall detected an increase from 3.2 million ransomware attack attempts in 2014 to 638 million in 2016. Kaspersky estimates that a ransomware attack was conducted against a business every 40 seconds in Q3 of 2016. Noteworthy stats to be sure, but what do such findings mean in terms of estimating incident likelihood?
Depending on what exactly is being measured, detections or attempted attacks typically align with FAIR’s notions of Contact Frequency (how often threats come into contact with a victim or asset) or Threat Event Frequency (rate at which threat agents act in a manner that could result in loss). Ransomware filtered by AV and other defenses can be seen as contact with the enemy. As that becomes more frequent and/or determined, it becomes more likely that something will slip through those defenses to cause a loss event.
Stats on ransomware loss events or incidents
Ransomware incidents handled by Beazley. Source: Beazley, 2017 Breach Briefing.
Sometimes what we’re given constitutes actual loss events, as is the case with this chart from Beazley. As a long-time collector of every incident I could get my hands on as part of Verizon’s Data Breach Investigations Report initiative, I know how rare and valuable this information can be. That said, does a higher rate of ransomware incidents within Beazley’s portfolio necessarily mean that the probability of infection is increasing? Perhaps ransomware incidents are growing proportionally with a growing number of cyber insurance clients. Perhaps reporting them is becoming easier or more incentivized. Other possibilities abound.
I appreciate Beazley sharing this information and I’d certainly incorporate it into my estimates…but having a denominator with which we could discern the proportion of clients experiencing ransomware incidents would boost stats like this to another level of awesomeness and usefulness. But I understand why they may not be able to or wish to do that. I struggled with these same issues and questions when reporting the number of incidents year-over-year for the DBIR.
Comparative ransomware statistics
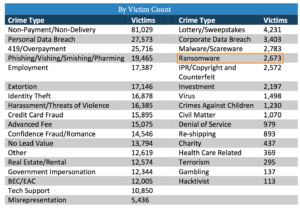
Types of reported incidents in 2016. Source: IC3 2016 Internet Crime Report.
We came across quite a few statistics about the comparative frequency of ransomware relative to other types of threats. This kind of information can be especially useful when the list of other threats includes some we’re familiar with from prior experience. I like to think of these as calibrating stats because we often overestimate threats that are new, severe, hyped, etc. The awareness that “Oh — X occurs less often than Y?!” can put things into proper perspective. And that’s very helpful when assessing key risk factors like frequency or probability, where a slew of biases conspire to ruin your judgement.
Take a look at the IC3 incident type stats shown here. Ransomware appears at the bottom half of the list at a rate that’s less than 1% of all reported incidents in 2016. Some things you’ve perhaps never heard of or aren’t that worried about rank well above it. Does that change your assessment of where ransomware stands on your list of concerns? Maybe, maybe not — but definitely worth taking into consideration.
Meta-analysis of statistics on ransomware prevalence
Of all the types of stats we were able to find about the rise of ransomware, the one that most closely approximates what we’re looking for fits the common definition of prevalence in epidemiology. I underline “most closely approximates” because it is not equivalent to our desired measures of LEF or probability of infection. But it’s the best we could find and at least gets us in the ballpark. Think of prevalence as the proportion of organizations in a population that experienced a ransomware incident. If you’ll permit loosening “in a population” to “in a given group,” the table below lists several surveys and empirical studies on ransomware prevalence. Note that we’ve narrowed the scope of our source material based on these criteria:
- The statistic must relate to actual incidents, not just attacks.
- The statistic must related to organizations rather than individuals or computers.
- The sample size must be specified somewhere in the source document.
- The source must refer to data collected in 2016 or 2017.
| Stat | Source | Year | Method | Sample |
| 32% | BSI, Ergebnisse der Umfrage zur Betroffenheit durch Ransomware | 2016 | Survey | 592 organizations |
| Notes: This report is written in German. We assume their use of the word “infektion” is equivalent to the english counterpart, and this refers to actual incidents. | ||||
| 36% | Fortinet, Q4 2016 Threat Landscape Report | 2016 | Empirical | 10K+ organizations |
| Notes: This is based on botnet activity, so infection is implied. It is unclear exactly how many organizations are included but a footnote suggests tens of thousands of firms. | ||||
| 46% | IBM, Ransomware: How Consumers and Businesses Value Their Data | 2016 | Survey | 600 organizations |
| Notes: States “46% have experience with ransomware attacks,” which may be different from infection. However, it also says 70% of those who “have experience” paid to get their data back. So We assume “have experience” = “incident” in this case. | ||||
| 20% | Kaspersky, Cost of Cryptomalware : SMBs at the Gunpoint | 2016 | Survey | 3000 organizations |
| Notes: This report focuses on small to medium businesses. As such, it’s not directly comparable to others in this table and may help explain why this data point falls on the low side. | ||||
| 39% | Osterman Research / Malwarebytes, Understanding the Depth of the Global Ransomware Problem | 2016 | Survey | 540 organizations |
| Notes: Uses “experienced ransomware attack” and “impacted by ransomware” interchangeably. It suggests actual incidents, so we’ve made that assumption. | ||||
| 36% | Ponemon Institute / Carbonite, The Rise of Ransomware | 2016 | Survey | 618 organizations |
| Notes: The report actually states that 51% experienced ransomware, but the data provided in the appendix doesn’t seem to support that statistic. In a follow-up question, 29% of those who reported experiencing ransomware said they had “less than 1” incident. I’m not sure how that’s even possible, but setting that aside, we interpret this to mean 29% of those who “experienced” ransomware must have experienced it in a way that didn’t involve an actual infection. The 36% is the corrected statistic for those who had at least one incident based on that interpretation. | ||||
My initial reaction after we compiled these statistics was surprise; they’re a lot more compatible than I would have expected. I also find it very interesting that the empirical observations (admittedly only 1 sample) align with the survey results. Compare that to the huge gulf between empirical and survey-based sources apparent from the first post in this series on ransomware payment rates. What’s more, the lowball estimate here from Kaspersky could be considered an outlier because the sample only consisted of SMBs, which means it’s not really an apples-to-apples comparison to the others.
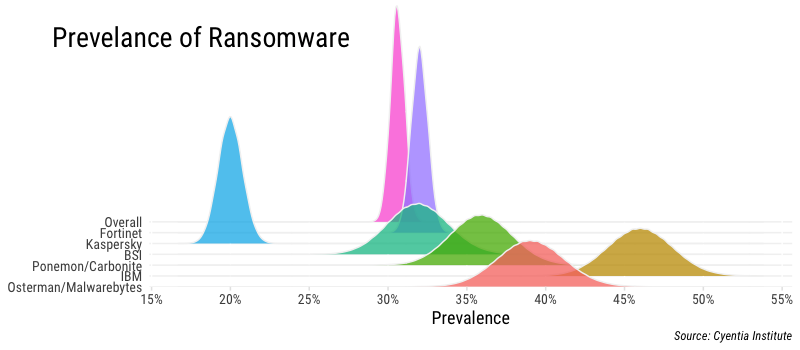
Meta-analysis of ransomware prevalence sources
The figure above presents beta distributions for each of the sources in the table above using parameters drawn from the sample details provided (number with ransomware; number without ransomware). The distributions encapsulate the uncertainty inherent to each sample based on the number of responses/observations they collected. For instance, the Osterman/Malwarebytes study gives a point statistic of 39% infected with ransomware, but given it’s a sample, we can’t assume 39% is exactly accurate. The distributions represent our confidence where the “real” value is likely to fall. You’ll notice the Fortinet and Kaspersky distributions are more peaked, indicating less uncertainty due to the larger size of those samples. Our overall estimate for ransomware prevalence based on these samples is added in the figure as well, and falls between 30-32%. That’s a pretty tight margin…one we’re not very comfortable with, in fact.
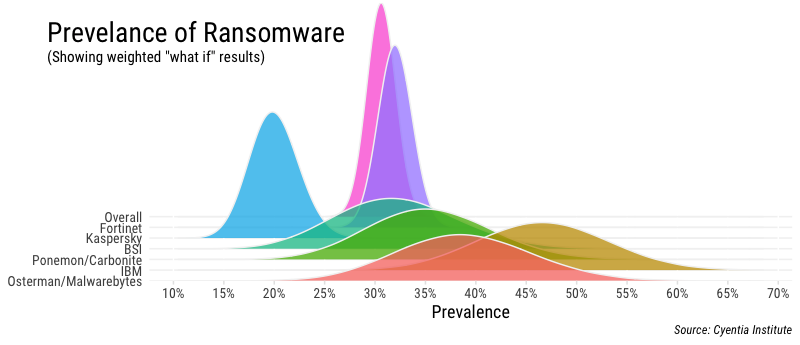
Let’s assume for a moment that, for various reasons, we have lower confidence in the soundness of the samples above than a strict interpretation of the sample size would yield. We could assign a different weight to each of these samples based on our confidence in its results. This may seem like cheating, but it’s actually a common practice. An excellent example of this is 538’s tracking of Trump’s approval ratings. Unfortunately, we have no historical outcomes here to show us which sources have proven to be more reliable. So we’ll run a “what-if” analysis that applies an equal “low confidence penalty” to them all and see how that changes things in the figure below.
Weighted meta-analysis of ransomware prevalence sources to account for lower confidence.
The effect of our “what-if” scenario is obvious. The distributions for each sample flatten out considerably, stretching their tails as it were, to compensate for higher uncertainty. Keep in mind this is just for visual effect and the point estimates (peak of the distributions) don’t shift; we’re just tweaking the spread or confidence around those estimates to get a feel for overall ranges. We could experiment with different weights and approaches here, but hopefully the point of doing something like this is made. Using this method and our chosen weights, our overall estimate of ransomware prevalence broadens a bit to about 27-34%.
Wrapping it up
Thanks for sticking with us through this rather lengthy post. We hope it not only supplied you with a multi-source estimate of ransomware prevalence, but also spawned some ideas on how you can use the many different types of frequency-based statistics out there on a wide range of threats.
We have extensive notes containing stats under each of the headings in this post, but they aren’t included here. SEO is yelling that it’s too long already. Nor are we including a small section originally written about top industries and countries for ransomware prevalence (Cliff’s notes: Healthcare; US/UK). If you’re interested in those for some reason, perhaps SSIC will share if you ask nicely. And speaking of our sponsor — a sincere thanks to them for supporting our research for this blog series on Measuring Ransomware. If you’re looking for the types of services they provide, this series attests to their desire for sound research and data.
Appendix: Data sources on ransomware prevalence EXCLUDED from this meta-analysis
| Stat | Source | Year | Method | Sample |
| 91% | Datto, State of the Channel Ransomware Report 2016 | 2016 | Survey | 1110 MSPs |
| Rationale for omission: They asked MSPs if any of their clients had been victimized by ransomware and 91% said yes. The denominator of that 91% is MSPs, not customer organizations, and thus we cannot determine prevalence across customers. That makes this one prone to misquoting (e.g., see the first bullet of this post). | ||||
| 43% | Researchscape International / Intermedia, Crypto-Ransomware: A Survey of IT experts | 2016 | Survey | 275 IT experts |
| Rationale for omission: They asked IT experts if any of their customers had been victimized by ransomware and 43% said yes. Same issue as the source above — the denominator is service firms, not customer organizations, and thus we cannot determine prevalence across customers. | ||||
| 6% | Kaspersky Labs, Consumer Security Risks Survey 2016 | 2016 | Survey | 12546 individuals |
| Rationale for omission: The sample consists of individuals rather than organizations, the latter being our focus for this analysis. Otherwise, this would be a great source. Check it out if you’re looking for consumer-level ransomware stats. | ||||
| 0.30% | Microsoft, Security Intelligence Report vol 21 | 2016 | Empirical | millions of computers |
| Reasons for omission: This is the global encounter rate of all reporting computers. The denominator is computers, not organizations, and thus we cannot determine prevalence as we have defined it for this analysis. Otherwise, this would be a great source of ransomware stats. Figure 53 on pg 84 showing the prevalence of malware categories across different countries is worth a look. | ||||
| 51% | Ponemon Institute / CounterTack, State of the Endpoint Report 2016 | 2016 | Survey | 694 organizations |
| Reasons for omission: Reports “51% say ransomware is a serious incident.” However, the actual question asks “Which of these types of incidents or compromises cause the most severe consequence?” So, this isn’t about actual incidents as much as it is about perceptions of relative severity. Another one likely to be misquoted if it hasn’t been already. | ||||
| 1.2% | Ponemon Institute / Keeper Security, 2016 State of Cybersecurity in SMBs | 2016 | Survey | 598 organizations |
| Reason for omission: The survey asks is the respondent experienced a cyber attack in the last year. 55% said yes. The follow-up question asks what type of attack, and 2% said ransomware. So, 2% of the 55% experiencing an attack experienced ransomware, which is roughly 1.2% of all respondents. We’ve excluded it because a) it seems to be about attacks rather than incidents and b) it is so far off the other prevalence stats – even others from Ponemon – that we have low confidence in its reliability. | ||||

